Analytics and Pop Health


Practice Management Infographics

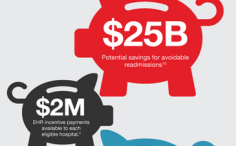
Using a picture and visual graphics to represent data and information is called an infographic. It is a great way to display statistical data that shows comparisons or charts that come from research and reports. In these Practice Management infographics, see what the real costs are of getting paid, what Million Hearts is, and where you stand with EHR’s.


Avoiding Common Healthcare Analytics Pitfalls

When you invested in an analytics, I’m guessing you signed up for data-driven solutions, not additional healthcare analytics pitfalls and inefficiencies. Yet that’s exactly what your health system is dealing with — problems and inefficiencies that keep popping up when all you really want to focus on is improving quality and cost.