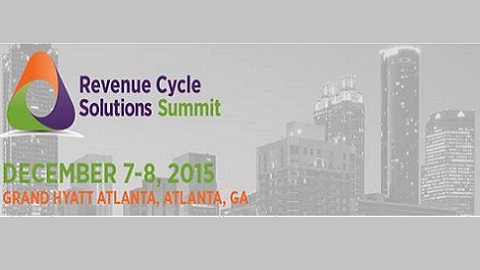
Healthcare Revenue Cycle and Finance


Revenue Cycle Issues Infographics

Using a picture and visual graphics to represent data and information is called an infographic. It is a great way to display statistical data that shows comparisons or charts that come from research and reports. In these infographics, see the transformation of value-base care, the top billing mistakes in women’s health, the true costs of transitioning to ICD-10, & RAC audits.


National Campaigns to Reduce Readmissions: What Have We Learned?

By Elizabeth H. Bradley, Amanda Brewster & Leslie Curry – Many people, particularly older patients, are readmitted soon after being discharged from the hospital. These unexpected return visits are expensive and challenging for patients and their families, and costly for Medicare. Nearly 20 percent of Medicare beneficiaries experience an unplanned hospital readmission, with an estimated cost to the American public of about $26 billion per year.